Home |
Download |
Support
Home |
Download |
Support
C-Free - A Professional Excellent C/C++ IDE
|
Home |
Download |
Support
|
C-Free - A Professional Excellent C/C++ IDE |
| Debug in C-Free |
|
C-Free provides basic debugging function. The following sections
guide you to use the debugging function in C-Free.
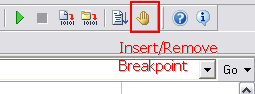
There are two methods to add a breakpoint: (2) Second method: Move the caret of
edit area to one line, and click on the "Insert/Remove Breakpoint" button
on the toolbar. The button is showed in the below figure:  3¡¢Breakpoint Conditions The simplest sort of breakpoint breaks every time your program reaches a specified place. You can also specify a condition for a breakpoint. A condition is just a Boolean expression in C/C++ language. A breakpoint with a condition evaluates the expression each time your program reaches it, and your program stops only if the condition is true.
From the Breakpoints dialog (as showed above), you can set condition for a breakpoint. Select one item from the list box of breakpoints, enter a expression for "Condition", and press "Set" button.
Click on the "Start Debug" button on
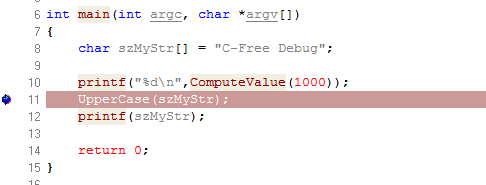
toolbar, the program begins to be debugged. The Debug toolbar appears: 6¡¢Step Into When the program breaks at one calling function statement, you can click on the "Stop Into" button on the Debug toolbar to run into the function body. As the following figure shows,
program breaks at
UpperCase
function: 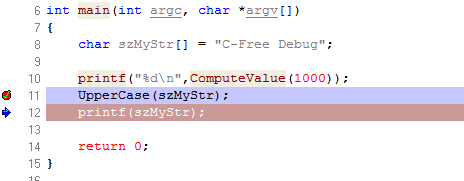
8¡¢Step Out When the program is break in a
function body, click on the "Step Out" button on the Debug toolbar, the
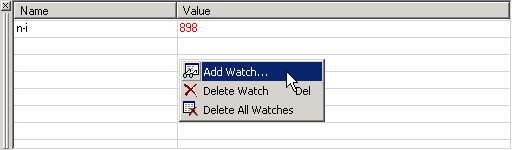
program will run to the position of return from the function. Click on the "Run to Cursor" button, the program will run to the line that the caret at. 10¡¢Locals When the program is break at debugging state, the Locals window displays the values of all local variables in the current context. The following figure shows two variables/values of the "ComputeValue" function runtime context: 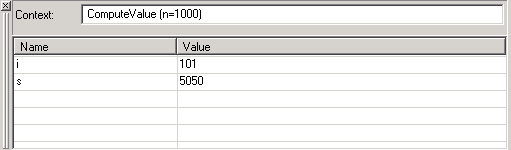 11¡¢Inspect/Change Right-click one item in Locals window, and choose "Inspect/Change" from the popup menu. Different dialog appears according to the type of variable you clicked on: array type, structure, or class variable: displays Inspector window. the other type variable: displays Change window. You can also double-click on one item in Locals window to display corresponding dialog. You can use Watch window to trace the value of a expression during debugging. Right click watch window, and choose "Add Watch" from the popup menu. You can enter the expression you want to trace.
Input address of variable such as &s, pVariable or ex240ff50 on the Memory window and press "Enter" key, you can look into the content of variable in the context of memory. The following figure is a Memory window.
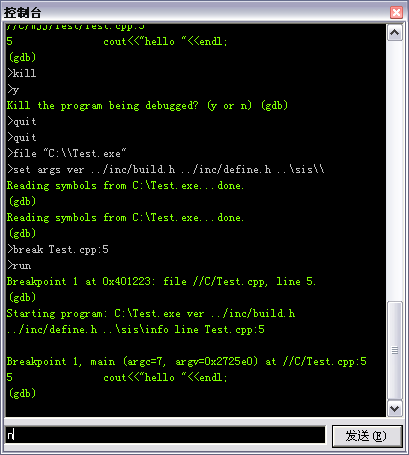
When debugging C-Free communicate with GDB debugger for information. By default the console window is displayed to list all input and output messages from GDB. You also can input commands directly to communicate with GDB.
|